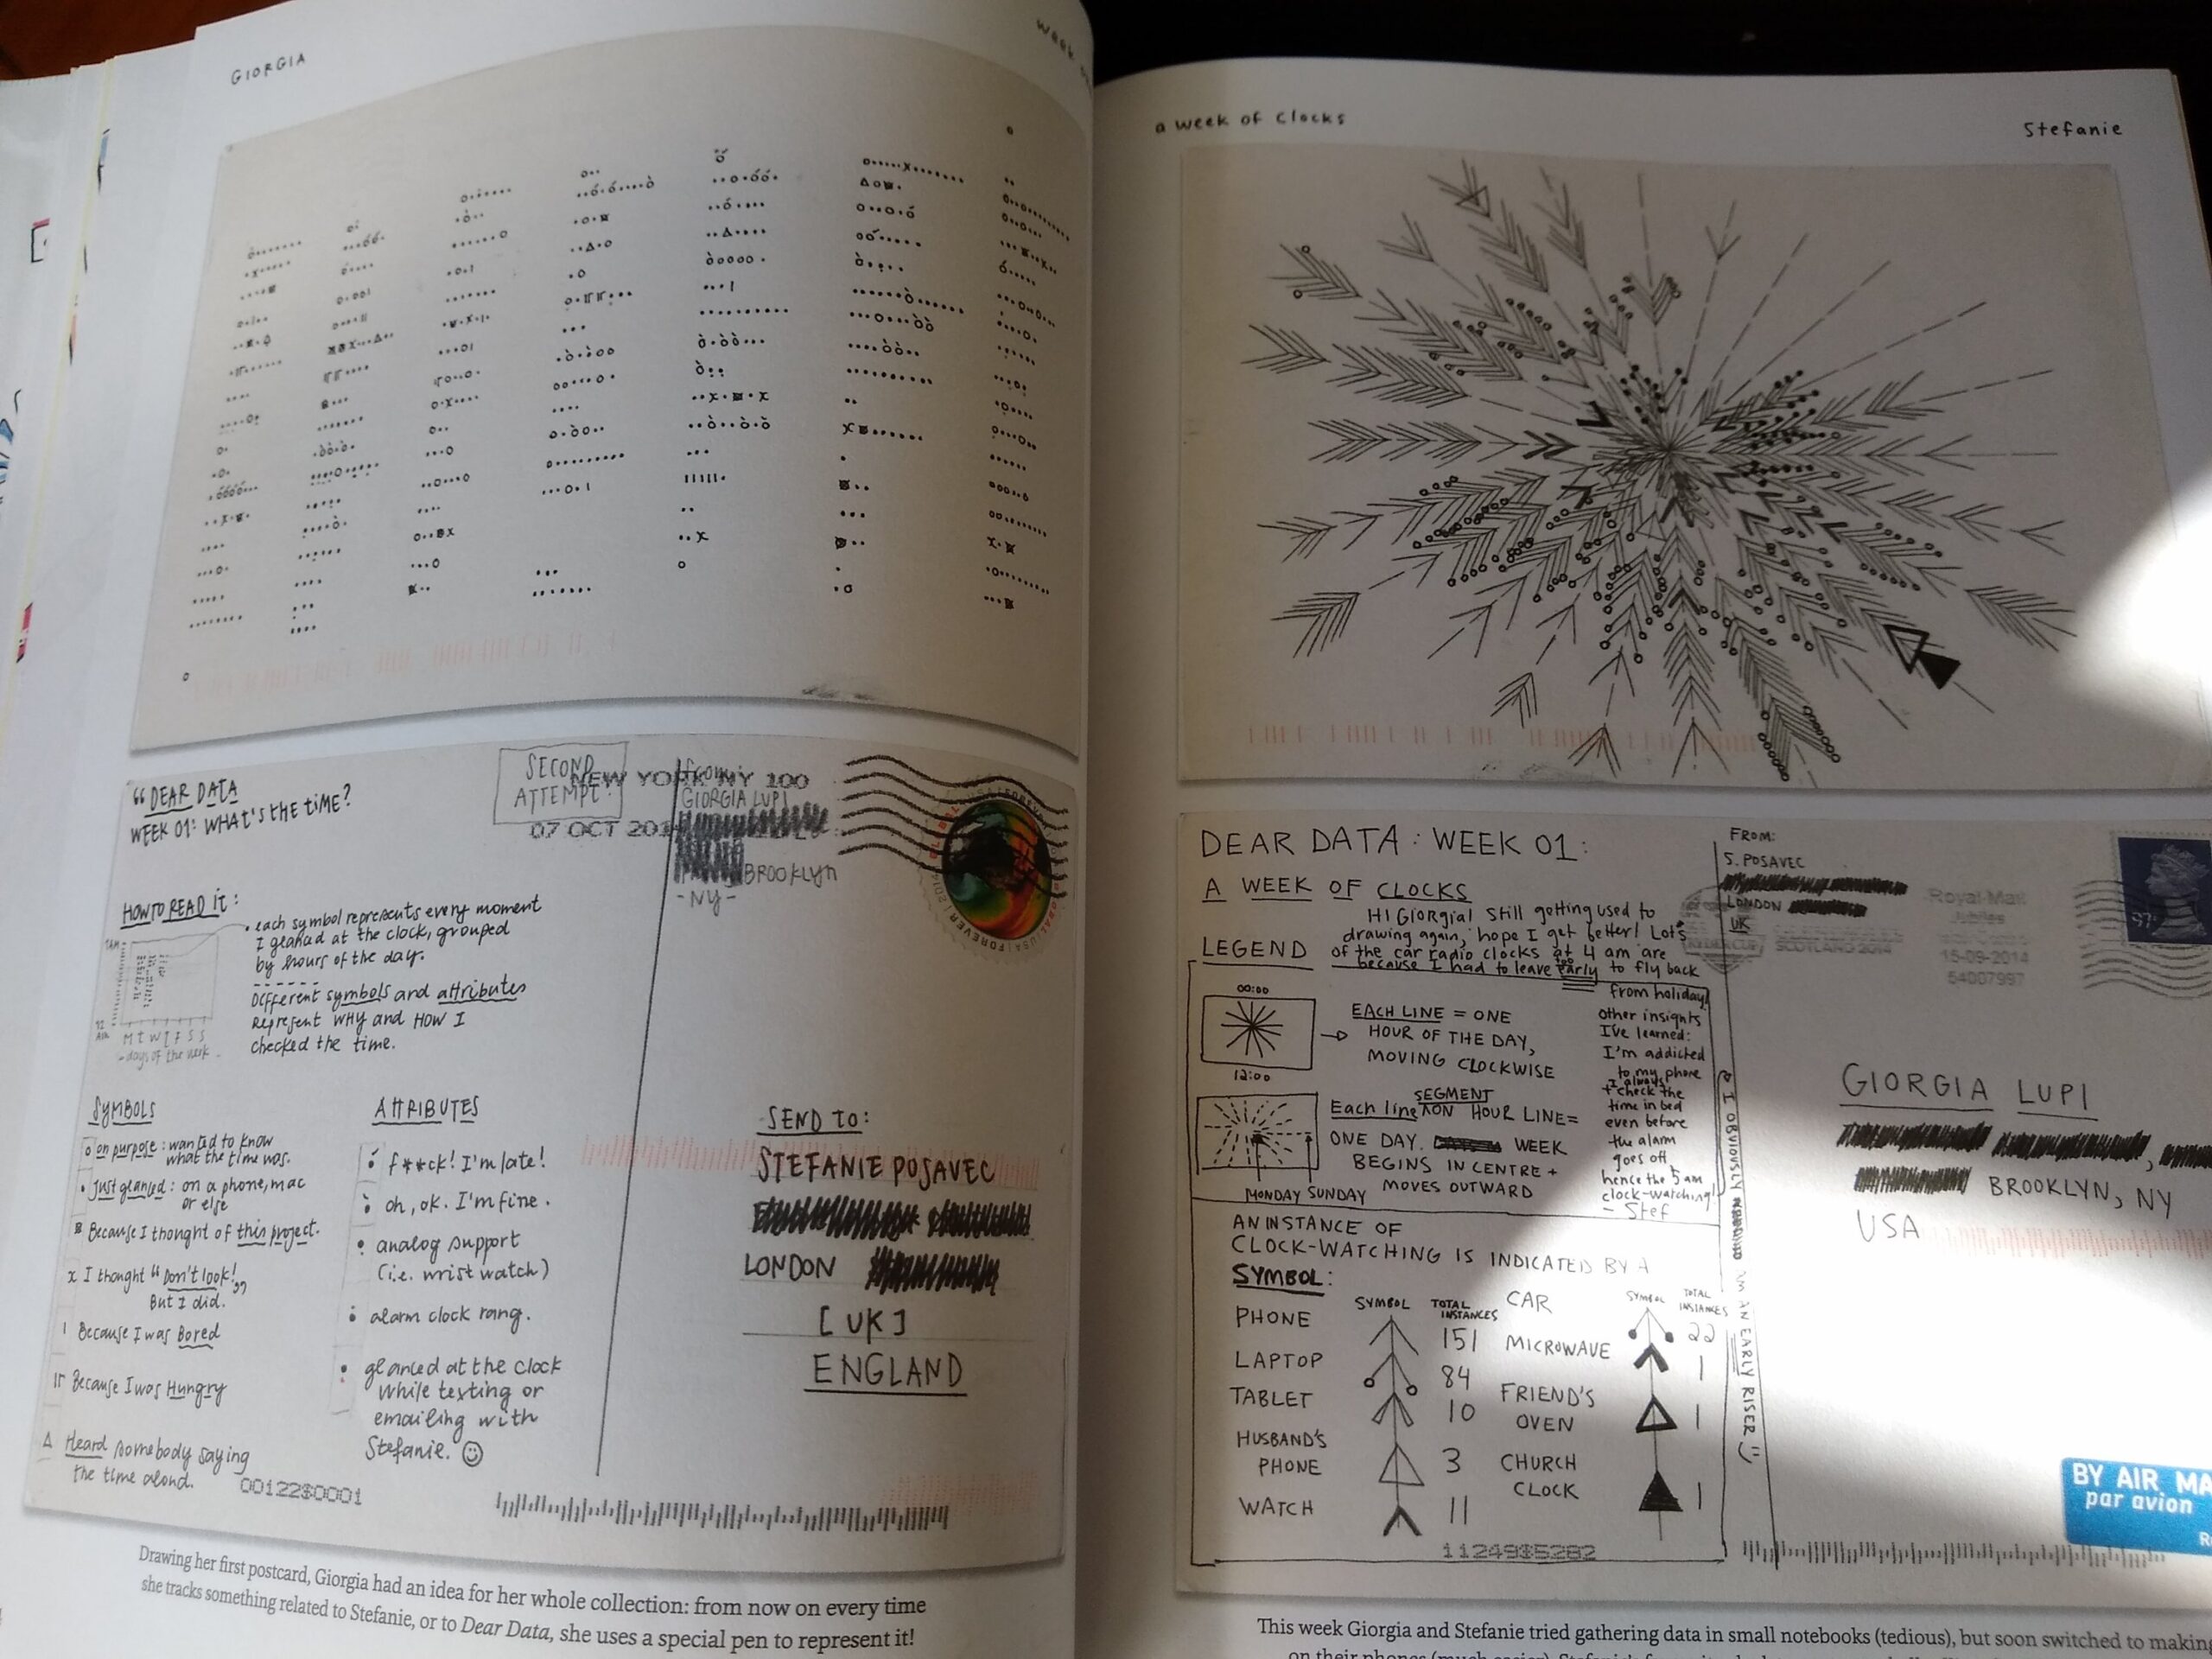
This week I picked up the book Dear Data by Giorgia Lupi, Stefanie Posavec. In this color and wimsicle book, the 2 authors who live across the Atlantic write weekly hand draw postcards to each other, using inforgraphics to tell each other a data centric view of a weekly topic.
During my 10 page a day reading commitment, I was able to deeply read the first 2 postcards. The first was about tracking how often they check the time (watch, computer, phones, laptops, hearing it). Each of the author created vastly different ways to represent the data. Giorgia uses different tick marks, with annotation and group the data vertically in columns. Stefanie uses a dial format like a clock using the distance from the center to represent the days of the week.
Each method has it’s pros an cons, depending on the question one wants to answer. Visually, I could tell that Stefanie spent a lot of time checking the time in her car in the beginning of week and end because she was traveling? For Giorgia, Thursday was a light day in clock watching. Mornings and noon time in the later end of the week was not clock watching.
